How To Interpret The Net Asset Value (NAV) Of The Amundi Dow Jones Industrial Average UCITS ETF

Table of Contents
What is the NAV and how is it calculated for the Amundi DJIA UCITS ETF?
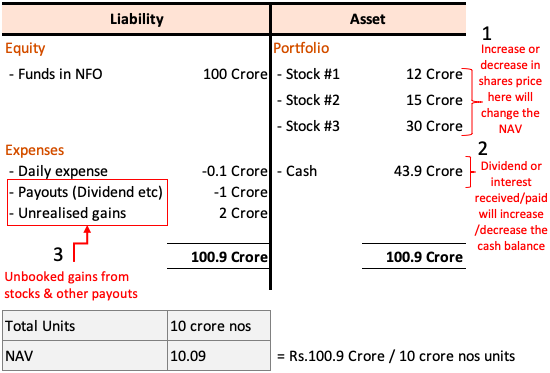
Net Asset Value (NAV) represents the total value of an ETF's assets minus its liabilities, divided by the number of outstanding shares. For the Amundi Dow Jones Industrial Average UCITS ETF, this means the NAV reflects the collective value of its holdings, which closely track the 30 constituent companies of the Dow Jones Industrial Average (DJIA).
-
Components of NAV: The NAV calculation involves determining the market value of each stock in the ETF's portfolio. This is done by multiplying the number of shares held for each company by its current market price. Any cash holdings and other assets are added to this total. Liabilities, such as management fees and other expenses, are then subtracted.
-
Impact of DJIA Holdings: Since the ETF aims to replicate the DJIA, the performance of the 30 component companies directly influences the NAV. A rise in the DJIA generally leads to a higher NAV, and vice versa.
-
Currency Exchange Rates: As a UCITS ETF, the Amundi DJIA ETF might hold assets denominated in different currencies. Fluctuations in exchange rates can impact the NAV, particularly for investors holding the ETF in a different currency. This requires careful consideration of currency risk.
-
Frequency of NAV Calculation: The NAV is typically calculated daily, reflecting the closing market prices of the underlying assets.
-
Finding the Daily NAV: Investors can usually find the daily NAV on Amundi's official website, reputable financial news websites, and through their brokerage platforms.
Factors that Influence the Amundi DJIA UCITS ETF's NAV
Several factors influence the daily NAV fluctuations of the Amundi DJIA UCITS ETF:
-
Market Performance of the Dow Jones Industrial Average: The most significant factor is the overall performance of the DJIA. Positive market movements generally lead to an increase in the NAV, while negative movements result in a decrease.
-
Dividends from Underlying Stocks: When the companies within the DJIA pay dividends, the ETF receives these dividends, which are then reinvested or distributed to shareholders, affecting the NAV. Reinvestment increases the number of shares held, while distributions slightly reduce the NAV per share.
-
Expense Ratio and Management Fees: These fees are deducted from the ETF's assets and reduce the NAV over time. It's essential to understand the expense ratio when comparing ETFs.
-
Currency Fluctuations: For investors outside the base currency of the ETF, fluctuations in exchange rates can influence the NAV they see in their local currency.
-
Corporate Actions: Events like mergers, acquisitions, and stock splits affecting the DJIA components will directly influence the ETF's holdings and consequently its NAV.
Interpreting the NAV and its implications for investment decisions
Understanding the NAV is crucial for informed decision-making:
-
NAV vs. Market Price: The ETF's market price can sometimes trade at a slight premium or discount to its NAV. This difference can be due to market supply and demand. Significant deviations might warrant further investigation.
-
Tracking ETF Performance: By monitoring the historical NAV data, investors can easily track the ETF's growth and performance over time, assessing its returns.
-
NAV and Investment Strategies: Investors can use the NAV alongside other indicators to determine suitable entry and exit points for their investments in the Amundi DJIA UCITS ETF. A rising NAV might indicate a favorable time to invest or hold.
-
NAV and Risk Assessment: NAV fluctuations reflect the inherent risk associated with investing in the DJIA. Sharp declines in the NAV signal a period of higher risk.
-
Regular NAV Monitoring: Consistent monitoring is vital to track performance, understand market trends, and make informed decisions about the Amundi DJIA UCITS ETF investment.
Conclusion: Mastering the Amundi Dow Jones Industrial Average UCITS ETF NAV
Understanding the Net Asset Value of the Amundi Dow Jones Industrial Average UCITS ETF is essential for successful ETF investing. By understanding how the NAV is calculated, the factors influencing it, and how to interpret it, you can make more informed decisions regarding your investment. Regularly checking the NAV and using it in conjunction with your overall investment strategy will significantly enhance your portfolio management. Learn more about managing your Amundi Dow Jones Industrial Average UCITS ETF investment by regularly monitoring its NAV and making strategic investment decisions based on your analysis.

Featured Posts
-
 Porsche Macan Buying Guide A Comprehensive Overview
May 24, 2025
 -
 Mia Farrow Seeks Legal Recourse Against Trump Over Venezuelan Deportations
May 24, 2025
 -
 Chto Udalos Nashemu Pokoleniyu Obyektivnaya Otsenka Dostizheniy
May 24, 2025
 -
 Today Show Anchors Absence Explained By Co Hosts
May 24, 2025
 -
 Avrupa Piyasalari Karisik Bir Guenden Sonra Durum
May 24, 2025
