Amundi Dow Jones Industrial Average UCITS ETF: NAV Calculation And Implications

Table of Contents
Understanding the Net Asset Value (NAV) Calculation
The Net Asset Value (NAV) represents the per-share value of an ETF. Understanding how this is calculated for the Amundi Dow Jones Industrial Average UCITS ETF is key to interpreting your investment performance.
Components of the NAV Calculation:
The NAV calculation is relatively straightforward, yet understanding its components is vital. It's determined by:
- Total Value of Assets: This is the sum of the market values of all the underlying holdings in the ETF, reflecting the current prices of the 30 constituent companies of the Dow Jones Industrial Average.
- Liabilities: These include any expenses associated with running the ETF, such as management fees (TER - Total Expense Ratio) and other operational costs. These are deducted from the total asset value.
- Outstanding Shares: This is the total number of Amundi Dow Jones Industrial Average UCITS ETF shares currently held by investors.
The formula for calculating NAV is: (Total Value of Assets – Liabilities) / Number of Outstanding Shares
The Dow Jones Industrial Average plays a central role. Because the ETF tracks this index, the NAV will generally move in tandem with the index's performance. A rising Dow usually translates to a rising NAV, and vice-versa. However, remember that the ETF's performance might slightly deviate due to the impact of fees and expenses. The TER, typically expressed as a percentage, directly impacts the NAV by reducing the overall value available for distribution among shareholders.
Daily NAV Calculation and Publication:
The NAV of the Amundi Dow Jones Industrial Average UCITS ETF is calculated daily, typically at the close of the market (check Amundi's website for precise timing). This calculation uses the closing prices of the constituent stocks in the Dow Jones Industrial Average.
Investors can find the daily NAV on:
- Amundi's official website: Amundi regularly updates its website with the latest NAV information for all its ETFs, including this one.
- Financial news websites: Many major financial news sources also publish daily ETF NAV data.
- Your brokerage account: Your brokerage platform will show the current NAV alongside the market price of the ETF.
Knowing the precise time of NAV calculation is important because it establishes a benchmark for daily performance and helps you to accurately assess your gains or losses.
Implications of NAV Fluctuations for Investors
Fluctuations in the NAV of the Amundi Dow Jones Industrial Average UCITS ETF directly impact investor returns.
Impact on Investment Returns:
The ETF's NAV moves in almost direct correlation with the Dow Jones Industrial Average.
- Rising NAV: A rise in the Dow generally leads to a rise in the ETF's NAV, resulting in capital gains for investors.
- Falling NAV: A decline in the Dow will typically lead to a decrease in the ETF's NAV, potentially leading to capital losses.
The relationship between NAV and the ETF's share price is very close, though minor discrepancies can occur due to trading activity and market liquidity.
NAV and Investment Strategies:
Understanding the NAV is crucial for various investment decisions:
- Buy/Sell Decisions: Investors might use the NAV (alongside market price and other indicators) to determine optimal buy and sell points. A low NAV, relative to perceived value, could signal a buying opportunity.
- Performance Benchmarking: The NAV is a key metric for tracking the ETF's performance over time and comparing it against other investments or benchmarks.
- Dividend Calculations: The NAV is often used in determining the amount of dividends paid out to ETF shareholders, if applicable.
Comparing NAV to Market Price
While closely related, the NAV and the market price of the Amundi Dow Jones Industrial Average UCITS ETF are not always identical.
Understanding the Difference:
The market price is the price at which the ETF is currently being traded on the exchange. This price can fluctuate throughout the day based on supply and demand. The bid-ask spread, the difference between the highest price a buyer is willing to pay and the lowest price a seller is willing to accept, contributes to the discrepancy.
Discrepancies between NAV and market price can arise due to:
- Liquidity: High trading volume usually results in a market price close to the NAV. Low liquidity can cause larger deviations.
- Demand: High demand can push the market price above the NAV, while low demand can push it below.
Implications for Trading:
The difference between NAV and market price can directly impact trading profits or losses:
- Buying Low, Selling High: If you buy when the market price is below the NAV and sell when it's above, you can profit from the difference.
- Bid-Ask Spreads: Understanding bid-ask spreads is crucial to minimizing transaction costs when trading ETFs.
Conclusion
This article has explored the intricacies of the Amundi Dow Jones Industrial Average UCITS ETF NAV calculation, its implications for investment decisions, and the nuances of its relationship with the market price. Understanding these factors is paramount for effective portfolio management and achieving your investment goals.
By understanding the Amundi Dow Jones Industrial Average UCITS ETF NAV and its implications, you can make better-informed investment choices. Learn more about the Amundi Dow Jones Industrial Average UCITS ETF NAV and other key investment factors by visiting [link to relevant resource]. Stay informed about your investment in the Amundi Dow Jones Industrial Average UCITS ETF by regularly monitoring its NAV and market price.
Featured Posts
-
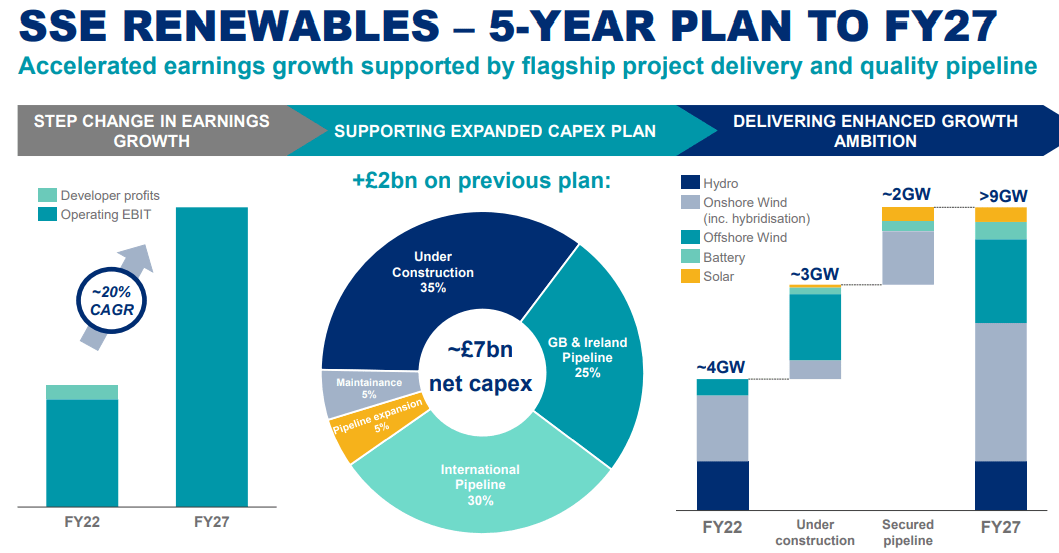 Sse Cuts Spending 3 Billion Reduction Amidst Economic Slowdown
May 24, 2025
Sse Cuts Spending 3 Billion Reduction Amidst Economic Slowdown
May 24, 2025 -
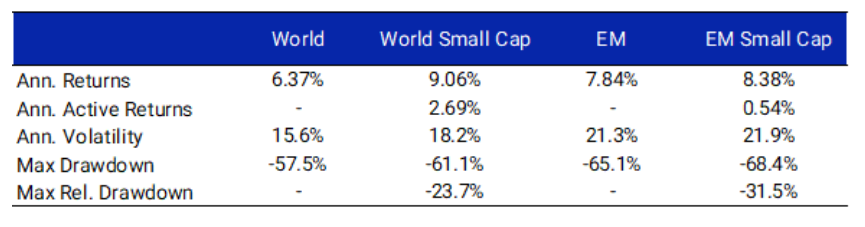 Apakah Mtel And Mbma Layak Dibeli Setelah Termasuk Dalam Msci Small Cap Index
May 24, 2025
Apakah Mtel And Mbma Layak Dibeli Setelah Termasuk Dalam Msci Small Cap Index
May 24, 2025 -
 De Minimis Tariffs On Chinese Goods The G 7s Current Stance
May 24, 2025
De Minimis Tariffs On Chinese Goods The G 7s Current Stance
May 24, 2025 -
 Tisice Prepustenych Analyza Situacie Na Nemeckom Trhu Prace
May 24, 2025
Tisice Prepustenych Analyza Situacie Na Nemeckom Trhu Prace
May 24, 2025 -
 130 Years After Injustice French Parliament Debates Dreyfuss Promotion
May 24, 2025
130 Years After Injustice French Parliament Debates Dreyfuss Promotion
May 24, 2025

